Visualize simple to complex sets of data, organize them and generate professional-looking reports that can be shared via the Power BI platform
Microsoft Power BI Desktop is a powerful data analytics and reporting tool designed as a companion desktop application for Microsoft’s Power BI service. It features interactive data visualization tools and data querying capabilities that work together to assist you in creating comprehensive, professional-looking reports that can be shared with business partners and customers.
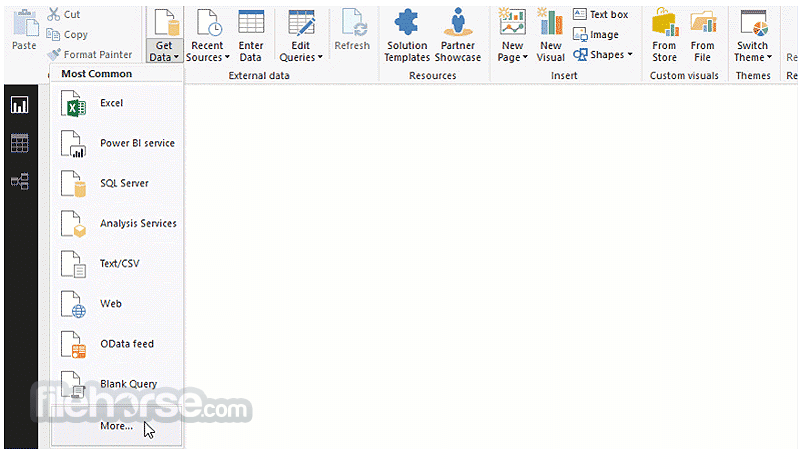
A plethora of sources to import data from
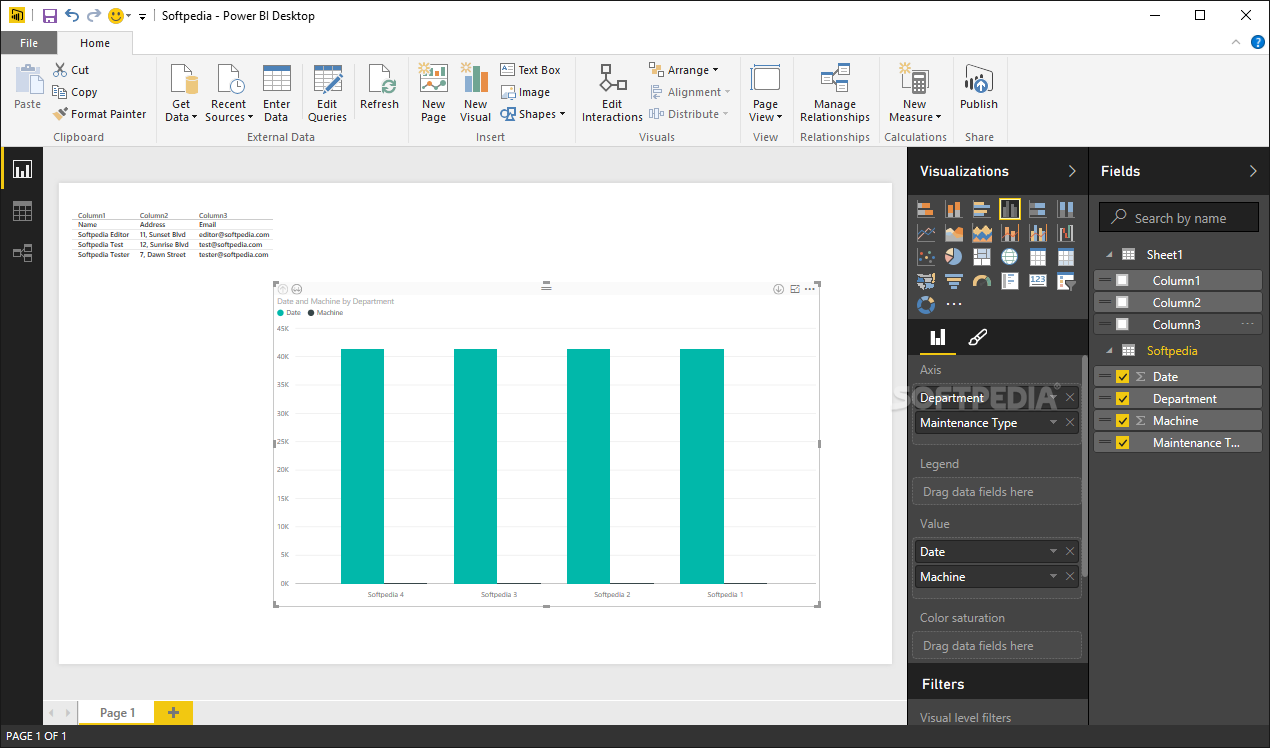
With a look that resembles other Microsoft-signed apps in the Office suite, Power BI Desktop provides one-click access to the available data importing and visualization tools, alongside a generous multi-page workspace where elements and objects can be moved around using simple drag and drop actions.
The range of data sources Power BI Desktop supports is more than enough to meet the requirements of the most demanding users, covering Excel workbooks, CSV, XML or text documents, simple folders, databases (SQL Server, Access, Oracle, IBM DB2, MySQL, PostgreSQL, Sybase, Microsoft Azure), Sharepoint, Active Directory, Microsoft Exchange, Hadoop, Google Analytics, Salesforce, Github, cloud services, and the list does not end here, as you can also enter data manually by creating new tables. In other words, Power BI Desktop is extremely versatile when it comes to connecting to your data.
Create compelling and rich visual representations
Designed as an advanced reporting tool, Power BI Desktop enables you to generate visual representations of complex data, which are much more easy to understand compared to raw tables. It comprises an assortment of graph and chart types, including maps, cards, and gauges. And if that is not enough, you can import additional custom visualizations.
Power BI Desktop provides one-click access to chart elements (axis data, legend, colors, values, filters, reference lines, labels, and so on), allowing full customization of the resulting report. You can choose which fields to include in a chart and which to ignore, and enrich your pages with text boxes, images or shapes. Data sets are in a similar way to database tables which allows you to configure relationships between fields.
Powerful reporting tool aimed at business users
With a modern-looking interface and accessible options, Microsoft Power BI Desktop offers an advanced reporting tool that can handle large data sets from various sources, combining them into a single comprehensive report that can be shared via the Power BI platform or exported to Pyramid Server. Unfortunately, reports cannot be saved in any other format. The desktop edition does not require signing in to a business Power BI account unless the user intends to publish the generated reports.
Filed under
Table of Contents Download


